

Your game runs at a smooth 60 fps, then hitches for a few frames every few seconds. On mobile it’s worse. That rhythmic stutter is very often the garbage collector cleaning up memory your scripts allocated and threw away. This guide explains Unity garbage collection in plain terms, shows how to find the GC Alloc culprits with the Profiler, lists the usual suspects with fixes, and covers incremental GC and real memory leaks.
What Garbage Collection Is
In C#, reference types (classes, arrays, strings, lists, delegates) live on the managed heap. When nothing references them any more, they become garbage. Periodically Unity’s garbage collector (Boehm GC) pauses your scripts, walks the heap, and frees what’s unused. The more you allocate, the more often it runs, and each pass costs time proportional to the heap’s size.
Value types (int, float, Vector3, structs) living in local variables or inside other objects don’t create garbage on their own. So the goal isn’t “never use memory”. It’s don’t allocate on the heap every frame. Allocations at load time are fine.
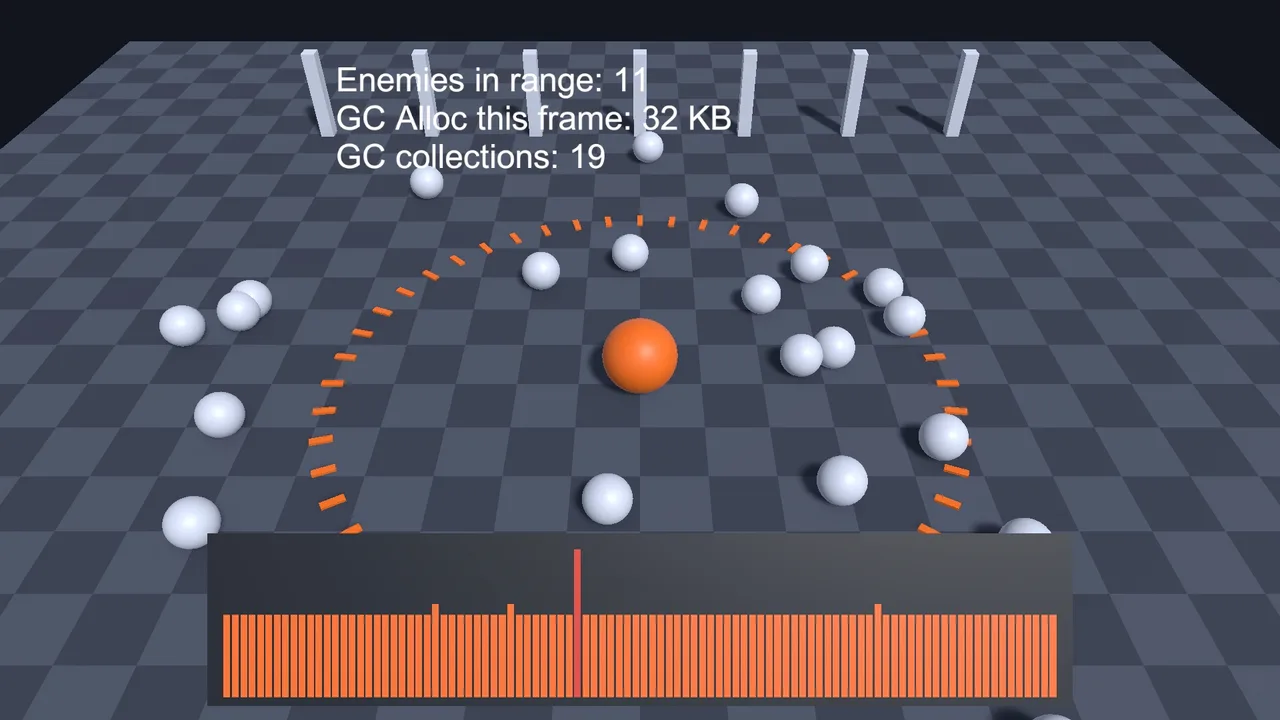
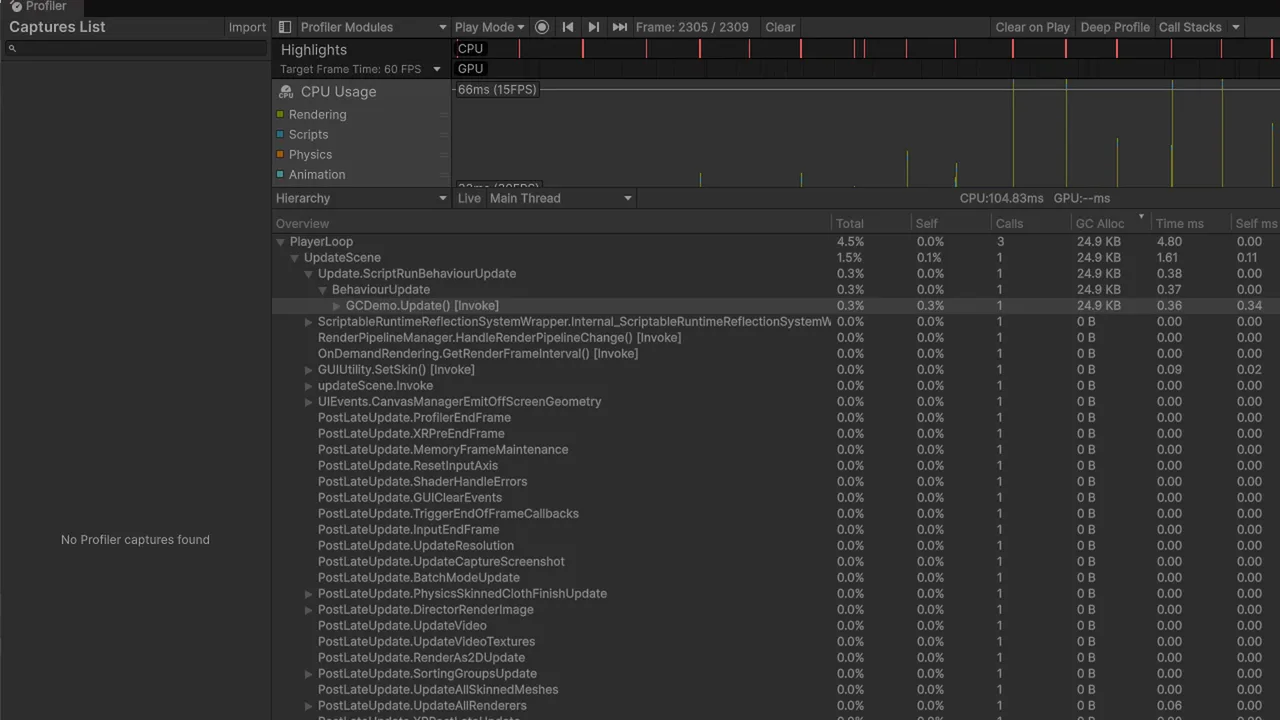
Finding GC Alloc in the Profiler
- Open Window > Analysis > Profiler and press Play. Ideally profile a development build on the target device, since the Editor allocates on its own.
- Select the CPU Usage module and a frame, and switch the bottom panel to Hierarchy.
- Click the GC Alloc column header to sort. Anything allocating every frame appears at the top.
- Expand entries to find your script method. Turn on Call Stacks (GC.Alloc) in the toolbar to see exactly which line allocated.
- Look for
GC.Collectin spike frames. That’s the collection itself.
The Memory module shows “GC Allocated In Frame”. In a steady gameplay loop, aim for 0 B most frames. Our Profiler beginner’s guide walks through the window in detail.
The Usual Culprits and Fixes
| Allocates | Why | Fix |
|---|---|---|
| String concatenation / interpolation in Update | Every new string is a heap object | Update text only when values change. Use TMP SetText("{0}", value) |
GetComponents, FindObjectsByType, Physics.RaycastAll, OverlapSphere |
Return new arrays | Use the NonAlloc / List overloads with a reusable buffer |
new List<T>() / new T[] in loops |
Fresh collection each call | Keep as a field and Clear() it |
LINQ (Where, Select, OrderBy, ToList) |
Enumerators, delegates, new collections | Plain for loops in hot paths |
| Lambdas capturing variables | Closure object per call | Cache the delegate, or avoid captures |
StartCoroutine + new WaitForSeconds |
New enumerator and yield object | Cache yield instructions, or use Awaitable |
Boxing (struct passed as object, enum as dictionary key in old runtimes, string.Format with ints) |
Copies the value onto the heap | Generic methods, avoid object parameters |
gameObject.tag == "Enemy", .name |
Returns a new string | CompareTag("Enemy") |
mesh.vertices, Input.touches |
Properties that copy arrays | Cache once, or use GetVertices(list) |
| Instantiate / Destroy constantly | Object churn | Object pooling |
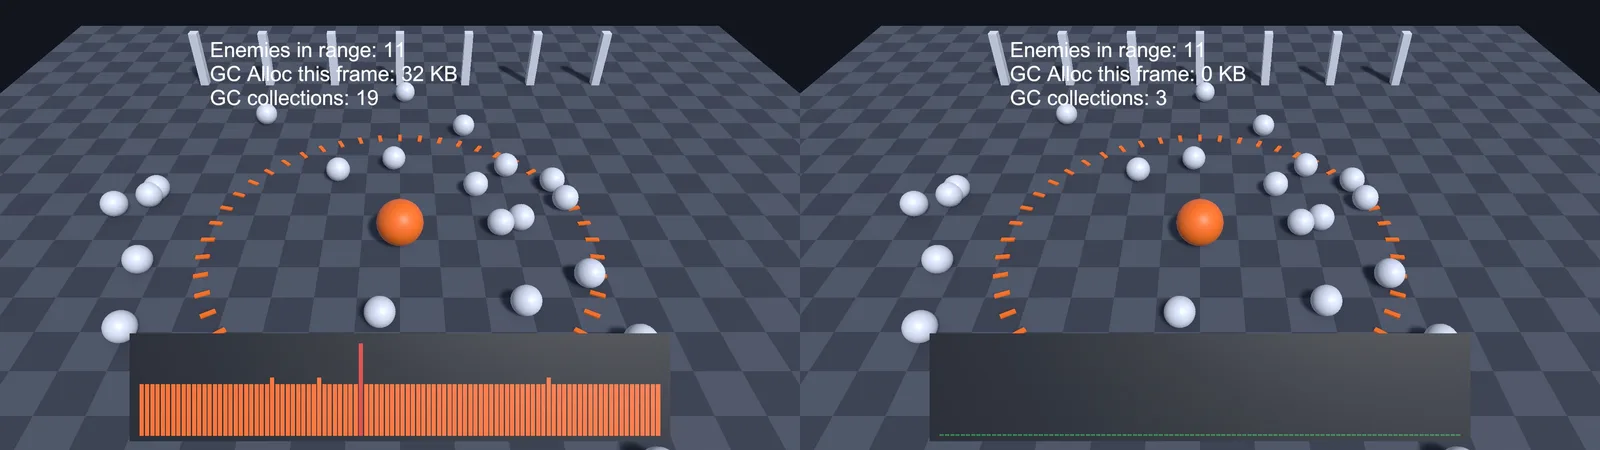
A typical before-and-after:
// BEFORE: allocates every frame
void Update()
{
    var hits = Physics.OverlapSphere(transform.position, 5f);
    var enemies = hits.Where(h => h.CompareTag("Enemy")).ToList();
    label.text = "Enemies: " + enemies.Count;
}

// AFTER: zero allocations
readonly Collider[] buffer = new Collider[32];
int lastCount = -1;

void Update()
{
    int n = Physics.OverlapSphereNonAlloc(transform.position, 5f, buffer, enemyMask);
    if (n != lastCount)
    {
        lastCount = n;
        label.SetText("Enemies: {0}", n);
    }
}
Using a layer mask instead of tag filtering is faster too (masks are explained in our raycast tutorial).
Pooling and Reusing Collections
Unity’s UnityEngine.Pool namespace has ready-made pools for both GameObjects and collections:
using UnityEngine.Pool;

// Temporary list without allocating
using (ListPool<Collider>.Get(out var list))
{
    GetComponentsInChildren(list);
    foreach (var c in list) c.enabled = false;
}   // list returned to the pool here

// Strings: reuse a StringBuilder for complex text
readonly System.Text.StringBuilder sb = new(256);
For bullets, effects and enemies, use ObjectPool<T>. Our object pooling guide has a full example. Cache yield instructions in coroutines (static readonly WaitForSeconds wait = new(0.5f);), or move to Awaitable, which Unity pools internally.
Incremental GC
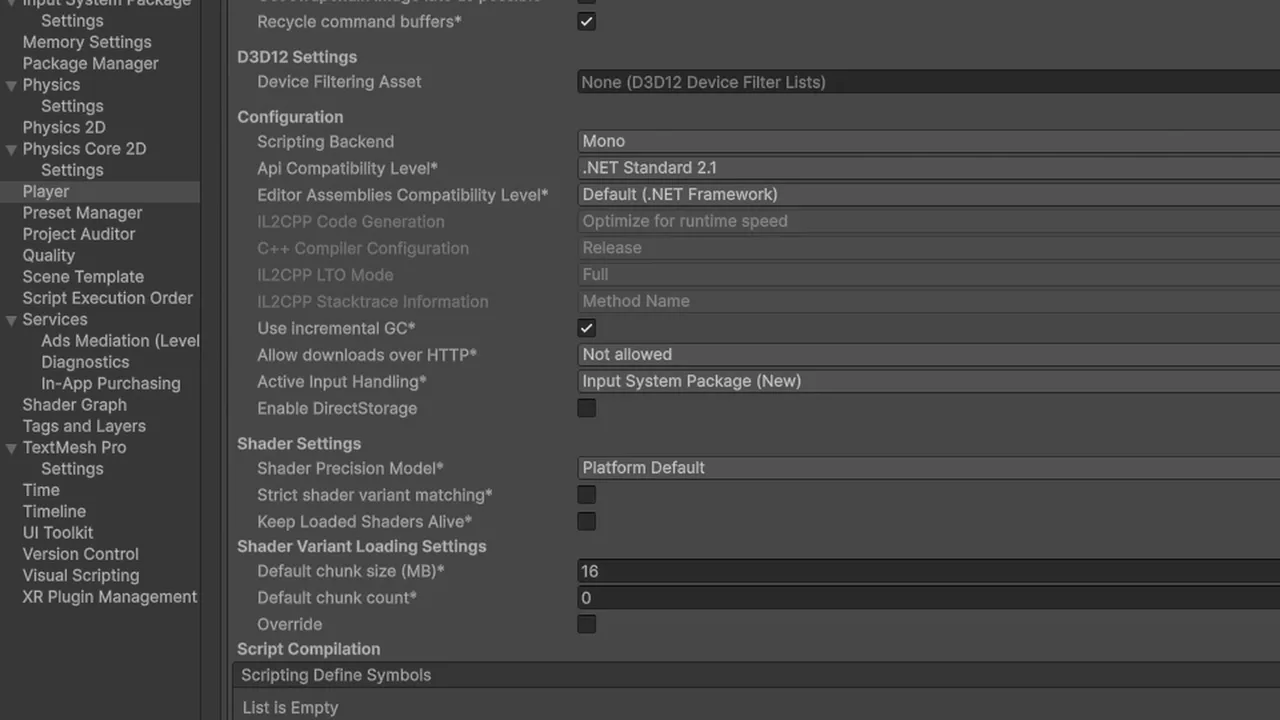
Incremental garbage collection (on by default in new projects, in Player Settings > Other Settings > Use Incremental GC) splits the collection across several frames instead of one big pause. It turns a 20 ms spike into many small slices that fit inside your frame budget.
It’s a big help, but not a fix: you still pay the total cost, and if you allocate very fast the GC can’t keep up and falls back to a full collection. Treat incremental GC as a safety net and keep reducing allocations. You can also trigger a collection at safe moments, such as during a loading screen, with System.GC.Collect().
Memory Leaks vs Garbage
Garbage is memory that can be freed. A leak is memory that never gets freed because something still references it, so memory climbs steadily over a play session. Common Unity leaks:
- Event subscriptions never removed. A static event holding a destroyed object’s method keeps the whole object alive. Always unsubscribe in OnDisable or OnDestroy (see C# events in Unity).
- Static lists/dictionaries that keep growing: caches, registries and “all enemies” lists that only ever add.
- Runtime-created assets:
new Texture2D,new Mesh, materials fromrenderer.material. These are native objects and needDestroy(). Accessing.materialclones it every time. - Addressables loaded but never released (see Addressables guide).
Find leaks with the Memory Profiler package: take a snapshot early, play for a while, take another, then compare them to see which objects increased.
⚡ Performance is a skill worth investing in
Understanding memory and the CLR pays off in every project. A couple of the programming books on our list explain it superbly.
A Practical Allocation Budget
- Gameplay loop: 0 B per frame most frames. Occasional small allocations (a pickup message) are fine.
- Mobile: be strict, since low-end devices have small heaps and slow CPUs.
- Loading / menus: allocate freely, then collect before gameplay starts.
Fit GC into your frame-time budget (see performance budgets and frame-time targets). Don’t micro-optimize code that runs once. Fix what the Profiler shows running every frame.
Troubleshooting
GC Alloc shows in the Editor but not the build
The Editor itself (Inspector repaint, Scene view, safety checks) allocates. Always confirm in a development build with Autoconnect Profiler.
Spikes every few seconds labelled GC.Collect
Continuous per-frame allocation fills the heap until a collection runs. Sort by GC Alloc and remove the per-frame offenders.
Memory keeps rising over a long session
That’s a leak, not garbage. Compare Memory Profiler snapshots and look for static collections, unremoved events and undestroyed runtime textures, meshes or materials.
Debug.Log is allocating
It is: string building plus stack traces. Strip logs from release builds or wrap them in a [Conditional("DEVELOPMENT_BUILD")] method.
foreach allocates
Over List and arrays it doesn’t in modern Unity. Over interfaces (IEnumerable<T>) and some custom collections it can, because the enumerator gets boxed. Use concrete types in hot loops.
FAQ
What causes GC spikes in Unity?
Allocating heap memory every frame (strings, arrays, lists, LINQ, closures, boxing), which forces frequent garbage collections that pause the game.
Should I turn on incremental GC?
Yes, for almost every project. It spreads collection over several frames and greatly reduces spikes.
Does Vector3 create garbage?
No. Vector3 is a struct (value type). new Vector3 doesn’t allocate on the heap.
Is calling GC.Collect manually a good idea?
Only at moments where a pause is invisible, like loading screens. Never every frame.
How do I find what’s allocating?
In the Profiler’s CPU Hierarchy view, sort by GC Alloc and enable allocation call stacks to see the exact methods.
Reader questions
Asked by readers of this article and answered by AI. Behavior can differ between Unity versions, so test in yours.



Leave a Reply