

Most Unity developers debug by sprinkling Debug.Log everywhere and squinting at the Console. It works, slowly. A real debugger lets you pause the game on any line, inspect every variable, and step through code one statement at a time. This guide covers debugging in Unity end to end: attaching Visual Studio, Rider or VS Code, breakpoints and watches, getting more out of Debug.Log, visual debugging with gizmos, and debugging builds running on a device.
Attaching a Debugger
First, make sure your code editor is set as Unity’s External Script Editor (Edit > Preferences > External Tools) and that its Unity integration is installed: the Game development with Unity workload for Visual Studio, the Unity plugin (built in) for Rider, or the Unity extension for VS Code. If IntelliSense isn’t working either, fix that first with our IntelliSense not working guide.
Then:
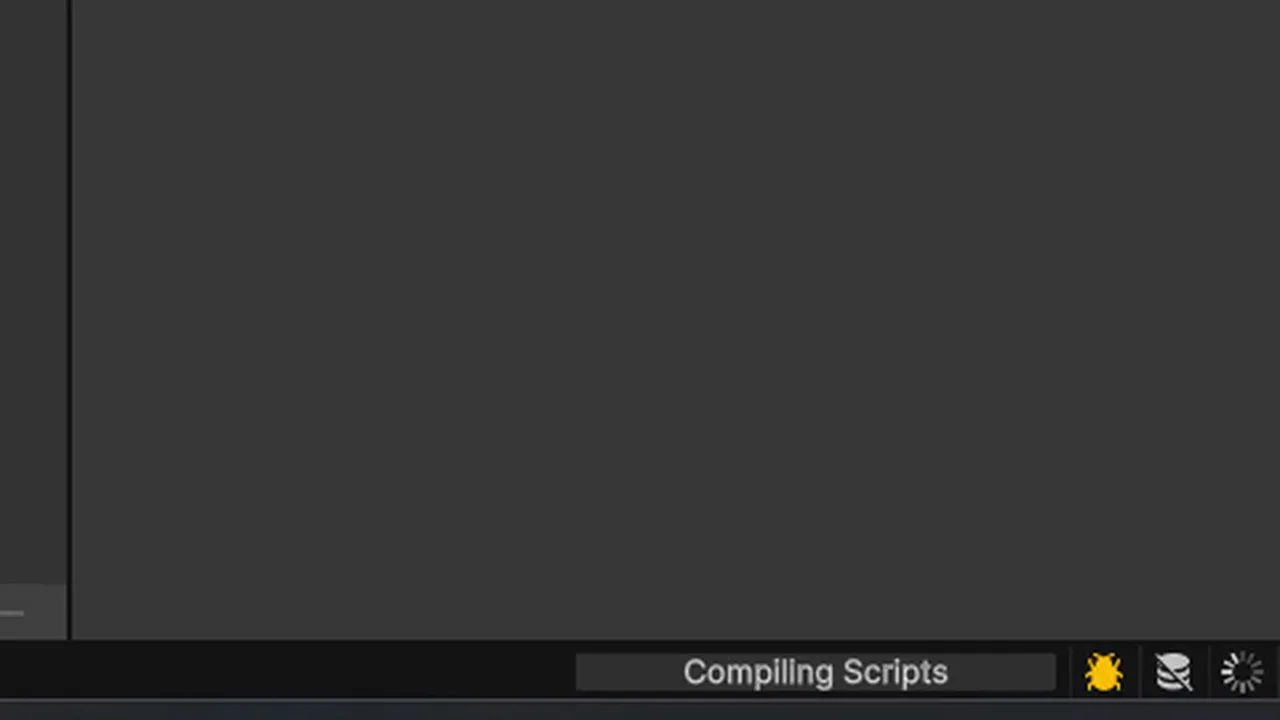
- In Unity, switch the Code Optimization toggle (the bug icon in the bottom-right status bar) to Debug Mode. Release mode is faster but can skip breakpoints and hide local variables.
- In Visual Studio, click Attach to Unity (the play button). In Rider, click Attach to Unity Editor. In VS Code, run the Attach to Unity debug configuration.
- Set a breakpoint and press Play in Unity.
Breakpoints, Stepping and Watches
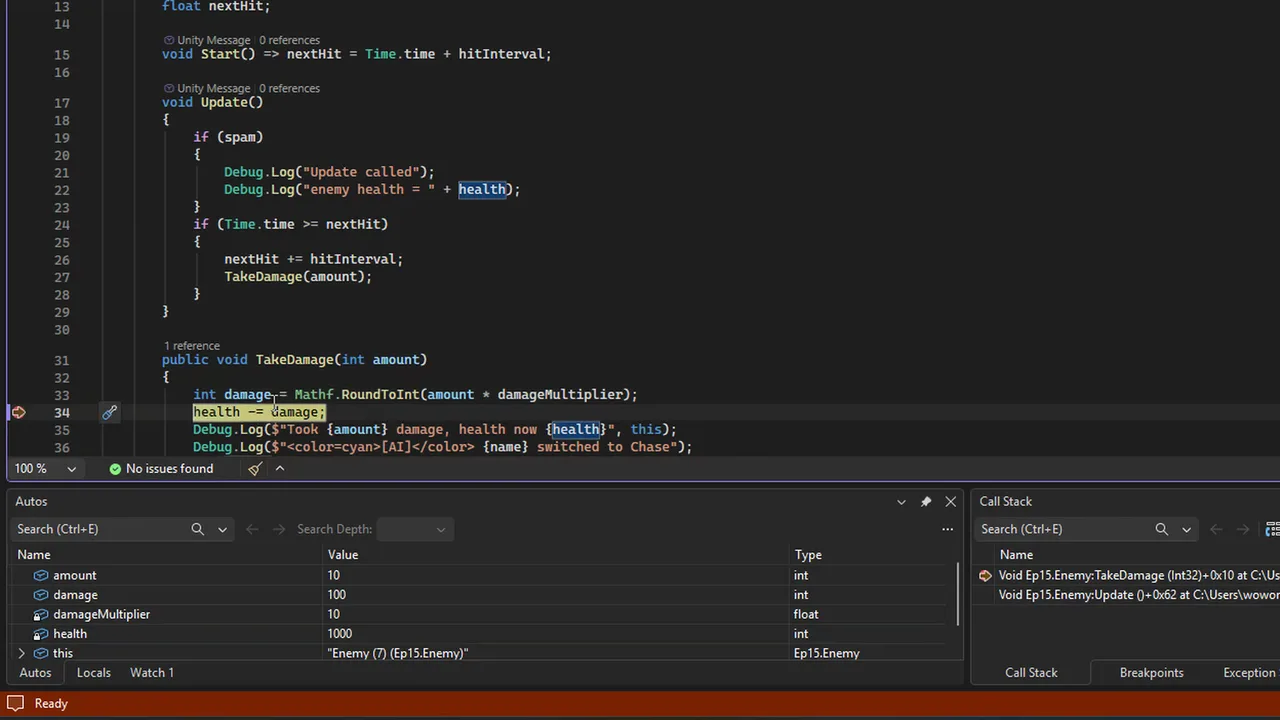
Click in the left margin of a line (or press F9) to add a breakpoint. When that line is about to run, Unity freezes and your editor jumps to it. Now you can:
| Action | Visual Studio / Rider key | What it does |
|---|---|---|
| Continue | F5 | Run until the next breakpoint |
| Step Over | F10 | Run this line, stop at the next one |
| Step Into | F11 | Go inside the method being called |
| Step Out | Shift+F11 | Finish this method, stop in the caller |
While paused, hover over any variable to see its value, use the Locals window to see everything in scope, and add expressions like player.transform.position or enemies.Count to the Watch window. The Call Stack shows how you got here, which is often the fastest way to find who called a method with bad data.
You can even change values while paused (edit a local in the Locals window) to test a theory without restarting.
Conditional Breakpoints and Tracepoints
A breakpoint in Update stops every frame, which is useless. Right-click the breakpoint and add a condition:
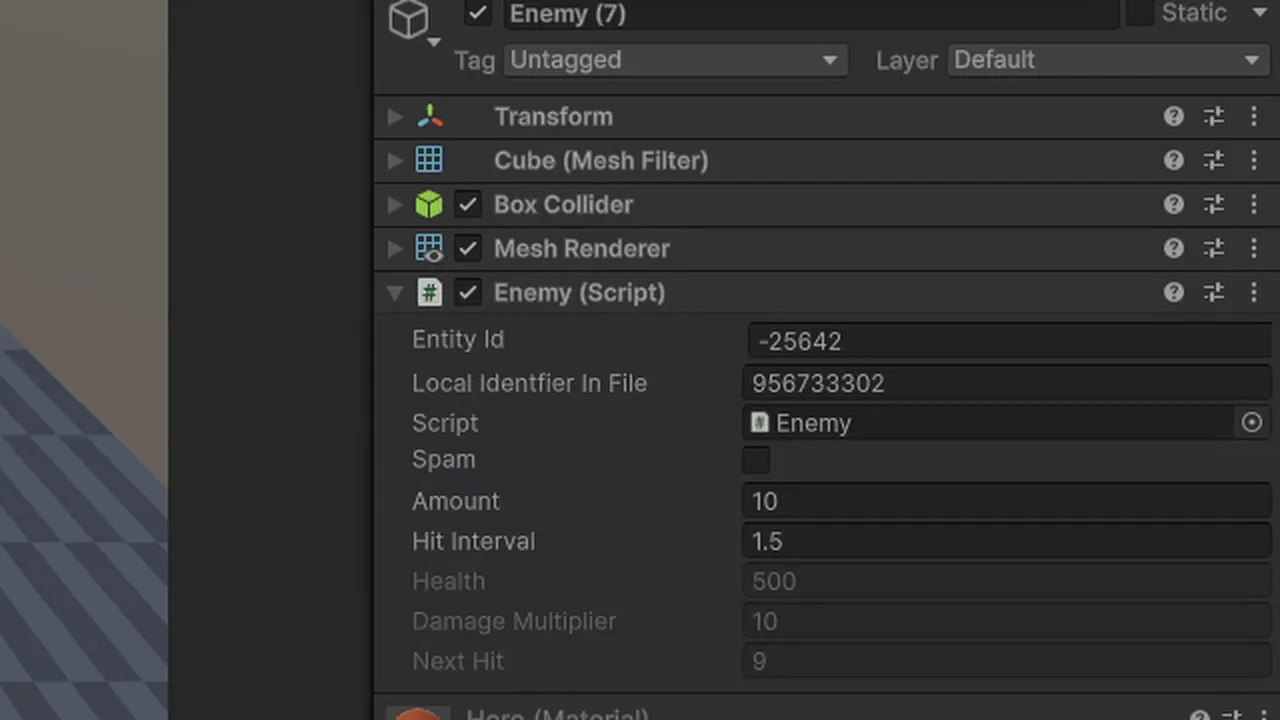
health <= 0: stop only when the player dies.name == "Enemy (7)": stop for one specific object.- Hit count: stop on the 100th call.
Tracepoints (Visual Studio: Actions > Log a message; Rider: Log evaluated expression) print a message without stopping or editing code. They’re like Debug.Log you never forget to remove.
Exception breakpoints are a lifesaver too: tell the debugger to break when a NullReferenceException is thrown, and it stops exactly on the bad line with all variables visible. That’s faster than reading stack traces (see fixing NullReferenceException).
Debug.Log Done Better
Logging still has its place, especially for timing-sensitive bugs a breakpoint would disturb. Make your logs more useful:
// Pass the object as context: clicking the log highlights it in the Hierarchy
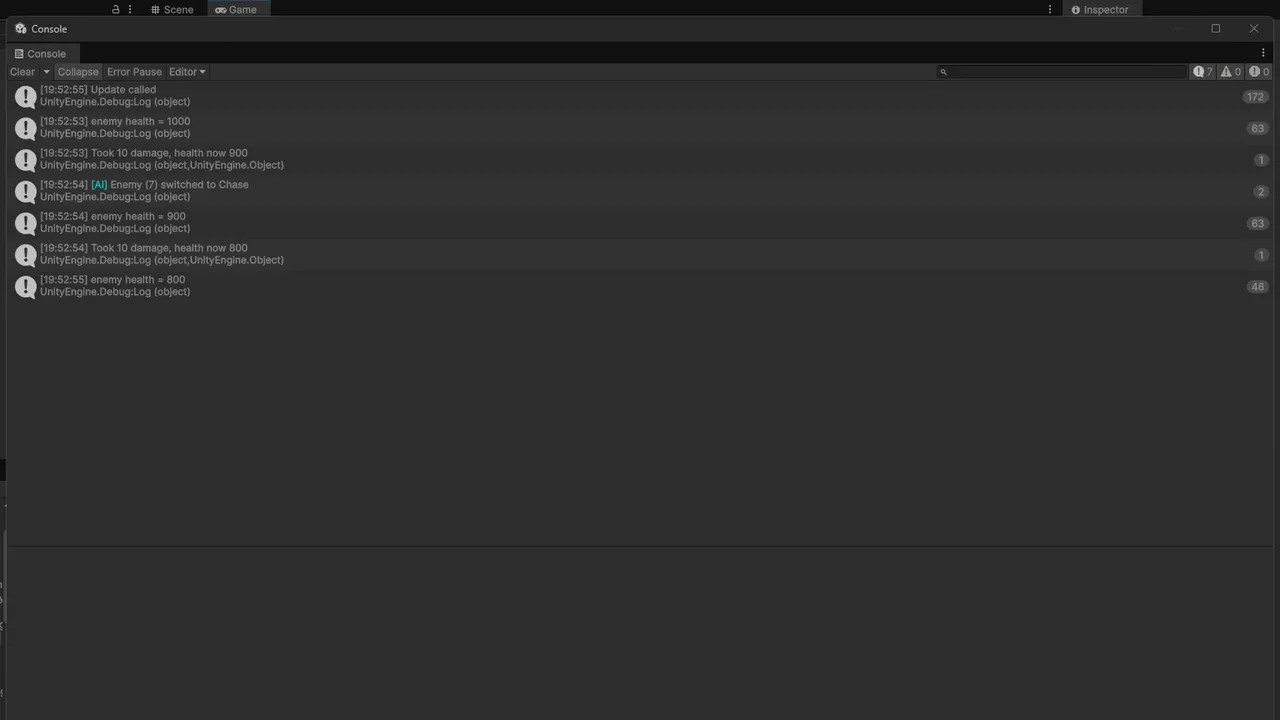
Debug.Log($"Took {amount} damage, health now {health}", this);

// Warnings and errors stand out and can be filtered
Debug.LogWarning("No spawn points set, using origin", this);
Debug.LogError($"Item id {id} not found in database");

// Rich text in the Console
Debug.Log($"<color=cyan>[AI]</color> {name} switched to Chase");

// Assertions: log an error only when something is wrong
Debug.Assert(waypoints.Length > 0, "Enemy has no waypoints", this);
In the Console, use Collapse to group repeated messages, the search box to filter by a tag like [AI], and enable Stack Trace Logging options for full traces. Logs allocate garbage and cost time, so strip them from release builds with a wrapper marked [System.Diagnostics.Conditional("UNITY_EDITOR")] or DEVELOPMENT_BUILD.
Visual Debugging: Gizmos, Debug.DrawRay and Debug.Break
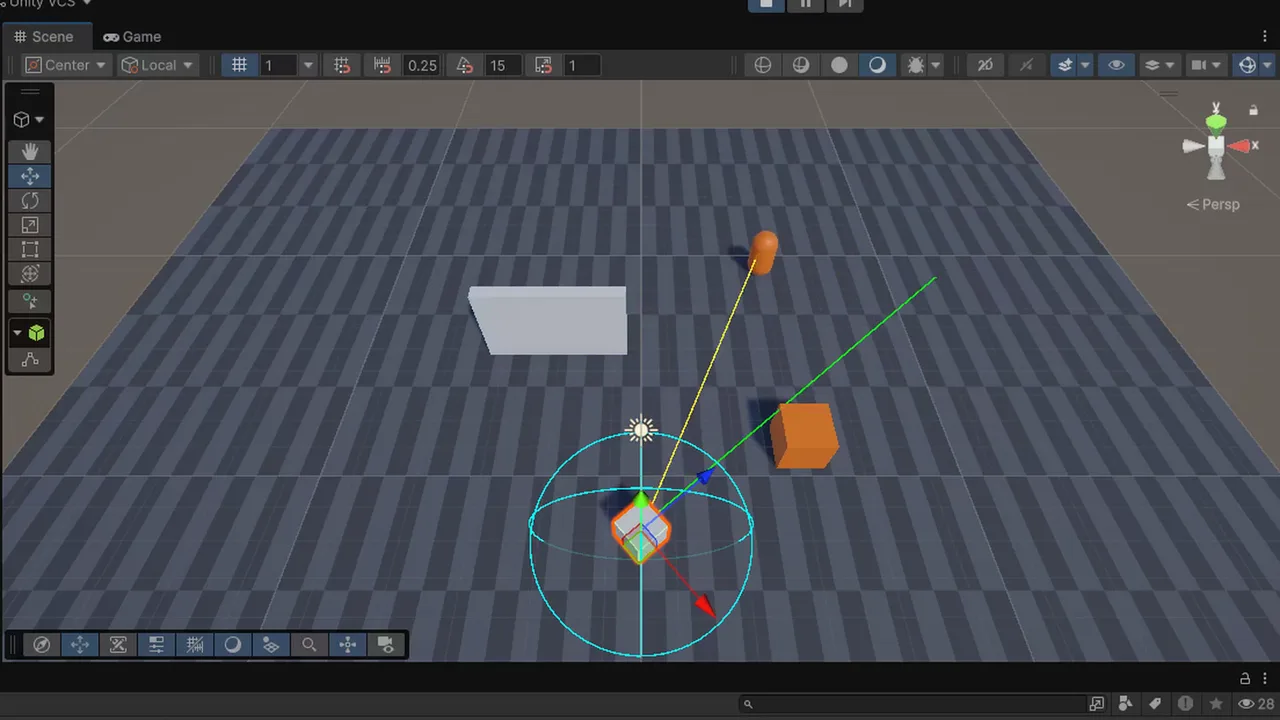
Many bugs are spatial: “why can’t the AI see me?”, “where is this ray going?”. Draw them:
void Update()
{
    // Visible in the Scene view (and Game view with Gizmos on) for one frame
    Debug.DrawRay(eye.position, transform.forward * sightRange, canSee ? Color.green : Color.red);
    Debug.DrawLine(transform.position, target.position, Color.yellow);
}

void OnDrawGizmosSelected()
{
    Gizmos.color = Color.cyan;
    Gizmos.DrawWireSphere(transform.position, attackRange);
}
Our raycast tutorial shows more visualization patterns. Debug.Break() pauses the Editor from code. Call it when something goes wrong (if (velocity.magnitude > 100) Debug.Break();), then inspect the scene frame by frame with the Step button next to Pause.
Other Built-in Tools
- Inspector Debug mode: click the ⋮ menu at the top of the Inspector and choose Debug to see private fields’ current values without code changes.
- Profiler: for “it’s slow” rather than “it’s wrong” (see our Profiler beginner’s guide).
- Frame Debugger: for rendering problems, stepping through each draw call.
- Physics Debugger (Window > Analysis): shows colliders, contacts and queries, which helps when OnTriggerEnter isn’t firing.
- Input Debugger: shows devices and live action values for the Input System.
💻 Debugger feeling sluggish?
Running Unity, an IDE and a debugger at once needs RAM. If attaching takes forever, a hardware upgrade may help. Our dev laptop guide has budget options with 16–32 GB.
Debugging Builds and Devices
Some bugs only happen in builds. To debug them:
- In the Build Profile, tick Development Build and Script Debugging (optionally Wait For Managed Debugger to pause at startup until you attach).
- Run the build, then in your IDE use Attach to Unity Process and pick the player (it appears by device and IP on the local network).
- Read the Player log for errors. On Windows it’s in
%USERPROFILE%\AppData\LocalLow\<Company>\<Product>\Player.log, on Android useadb logcat -s Unity, and on iOS use the Xcode console.
A development build also shows errors on screen in a corner console, which is useful for testers.
Troubleshooting
Breakpoints are hollow or never hit
Unity is in Release code optimization mode, the debugger isn’t attached to the right Unity instance, or the code hasn’t recompiled. Switch to Debug Mode, re-attach, and make sure the script compiled (no Console errors).
“Attach to Unity” finds nothing
The Unity integration package isn’t installed in the IDE, or a firewall blocks the debugger port. Reinstall the Unity workload or plugin and allow Unity through the firewall.
Unity freezes when I hit a breakpoint
That’s expected: the Editor waits while you’re paused in the debugger. Press Continue (F5) in the IDE.
Local variables show “optimized away”
Release mode optimizations. Switch to Debug Mode.
Logs don’t appear in the Console
The Console’s log, warning or error filter buttons are toggled off, or a search term is filtering them.
FAQ
How do I debug Unity with Visual Studio?
Install the Game development with Unity workload, set Visual Studio as the external editor, switch Unity to Debug Mode, click Attach to Unity, set a breakpoint and press Play.
Can I use breakpoints in a Unity build?
Yes. Make a Development Build with Script Debugging enabled, run it, and attach your IDE to the player process.
What’s the difference between Debug.Log and a breakpoint?
Debug.Log prints a message and keeps running. A breakpoint pauses execution so you can inspect every variable and step through code.
How do I see private variables without a debugger?
Switch the Inspector to Debug mode from its ⋮ menu.
Does Debug.Log slow down my game?
Yes. It allocates and captures stack traces. Strip logs from release builds.
Reader questions
Asked by readers of this article and answered by AI. Behavior can differ between Unity versions, so test in yours.



Leave a Reply